
What's wrong with this dyno chart?


Thread Starter
My 8 looks like a Smurf
iTrader: (4)
Joined: Sep 2007
Posts: 1,742
Likes: 2
From: Ottawa, ON, Canada
What's wrong with this dyno chart?
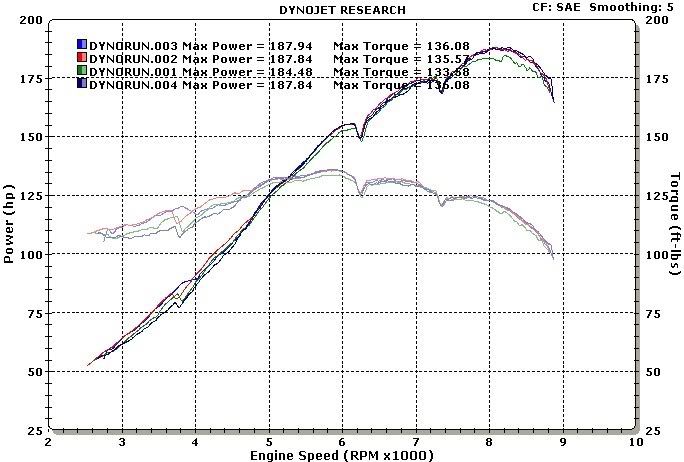
Well I finally got my car dyno'ed but there are 2 weird dips in the curve.
Would anyone with more dyno experience care to comment as to why this would happen? The guys at the shop said I should run 94 octane but this car should run fine on 91 so I want to find the root cause of the problem.
Mods are in my sig. I had also just installed the CAI right before stepping onto the dyno.
Thanks!

So you have a MT with intake/exhaust/underdrive pulley, got a dyno that only runs to 7329 rpms and made 192 whp on a mustang dyno? Nothing about that dyno seems right to me. As for the dips, there are dips in a regular dyno plot but I don't know if they are usually that pronounced and if that is the right location. I'll hit the dyno comparison thread and look.
Edit: The stock dyno example showed torque dips (less pronounced than yours) at or about 6300 and 7200 rpms probably resulting from changes in intake geometry to maintain good VE at higher RPMS (ie the opening of additional ports). A MT should have a good 1500 rpms above where you dynoed to with a power peak in the 8000s. I'm not sure how much you can move that peak with intake/exhaust/pulley but probably not a ton.
Edit: The stock dyno example showed torque dips (less pronounced than yours) at or about 6300 and 7200 rpms probably resulting from changes in intake geometry to maintain good VE at higher RPMS (ie the opening of additional ports). A MT should have a good 1500 rpms above where you dynoed to with a power peak in the 8000s. I'm not sure how much you can move that peak with intake/exhaust/pulley but probably not a ton.
Last edited by maxxdamigz; Jul 7, 2008 at 03:05 PM.
Thread Starter
My 8 looks like a Smurf
iTrader: (4)
Joined: Sep 2007
Posts: 1,742
Likes: 2
From: Ottawa, ON, Canada
The reason it was cut off at 7329 is that after this the curve started to go back down. The guys at the shop said they usually cut the printout at the peak so I didn't argue too much. Next time I'll make sure to get it all the way to 9k.

The Local Idiot
Joined: May 2008
Posts: 406
Likes: 0
From: Big D, Texas
Nothing wrong at all with that dyno... it looks somewhat odd due to the scale used on the Y axis of the torque plot. I'm assuming of course that the red line is HP, and the black line is torque, but you're seeing the small dips in power that every RX8 has when the secondary and tertiary intake ports open up (at ~3750 and ~6250 RPM respectively). You're looking at a 3-5 ft/lb dip for each, which I think is fairly normal... like I said, it's just the scale used that makes it look drastic. You can also see another torque dip at the very end of the run caused by the VDI valve opening up around 7250 RPM.
The HP curve looks very normal from what I've seen of other people's dynos.
The HP curve looks very normal from what I've seen of other people's dynos.
Yeah, I was put off a bit by the torque scaling in particular which is very tight. Anyway, 192 NA on a mustang dyno is very strong. It always irks me when shops just deliver peak numbers as that's just a set of numbers to put in your signature. You'd need a complete torque curve to redline to see how the car is running. A dyno to the mid 7000s is only good if you plan on only running your car to the mid 7000s. Did they give you wideband 02 data and see how rich you are running?
Thread Starter
My 8 looks like a Smurf
iTrader: (4)
Joined: Sep 2007
Posts: 1,742
Likes: 2
From: Ottawa, ON, Canada
No, I didn't get that.
You're right about the peak... I'd rather get a reading to 9000K as well. I will call them back and ask for it but I think they simply didn't dyno it to the redline. I want to push for it but don't want to make a huge scene as they are pretty much the only decent shop in town.
You're right about the peak... I'd rather get a reading to 9000K as well. I will call them back and ask for it but I think they simply didn't dyno it to the redline. I want to push for it but don't want to make a huge scene as they are pretty much the only decent shop in town.

You should pick up another 10hp or so if you run it to 8600 rpm (normally the peak for our engine) . The dyno shop have obviously never ran an 8 before or they would know to take it all the way . There is normally a dip right where they buttoned off .. Idiots !!!
So 200hp odd on a Mustang = excellent
So 200hp odd on a Mustang = excellent
Last edited by Brettus; Jul 7, 2008 at 04:41 PM.

I think it would look a lot more normal if it was plotted 0 to 200 on both scales with regular intervals on the X axis rather than the auto-zoom features. 200 NA on a Mustang dyno would be very high.

Registered
Joined: Oct 2007
Posts: 684
Likes: 14
From: Indianapolis, IN
Upon closer review and comparision to the pulls we've made, the data is fine. What is interesting is the 3rd stage ports opening at 7,100 +/- rpm AND THE MOTOR IS MAKING 190 RWHP at that point. Our experience has been that we see an additional 20 rwhp increase AFTER the 3rd stage ports opening. This would equate to 210 hp which appears awfully strong. Perhaps it's the custom race exhaust that is getting us some wonderful higher rpm power gains.
I'd be interested to know if this is the case if anyone has any data to support this theory.
Eric
I'd be interested to know if this is the case if anyone has any data to support this theory.
Eric


Power!!
Joined: Feb 2004
Posts: 4,412
Likes: 3
From: Sunny See attle
Where is the torque plot on your graph? If it's the black line there's something wierd going on. The torque curve should be flat at around 140 ftlbs from 5K to 8K or so and then start to tail off a bit. Both of these lines climb with RPM. This looks like two power curves side by side. Not a power and torque curve. The black line looks wrong.

Registered
Joined: Oct 2007
Posts: 684
Likes: 14
From: Indianapolis, IN
20 hp gain from the valley of the curve---apologies. My experiences have shown more than 20 from the valley and have more to do with higher rpm gains (which is where we operate our race cars).
My point was there are more gains in his motor that are not reflected in the dyno sheet--10 or more depending on how you look at it. These are good gains too because the hp curve typically goes a bit more linear up top before it falls off. Therefore, you get to enjoy those higher hp LONGER.
Since we're on the topic, it's important to note in testing that it's not about PEAK hp, it's about finding the total area under your new, higher dyno curve. This represents ALL gains over the entire rpm range----not just the peak gain.
As you all probably know, it's possible to increase your PEAK hp by 10 but actually have a less powerful motor if the other areas besides the peak actually go DOWN. We find this all the time when testing---a few gains here and a few losses there. You have to look at the area under the curve of the rpm range you operate at to confirm total power gains (or not).
This is a good post for those about to begin dyno testing. Remember to inflate your tires to the same psi everytime, use the same octane and warm up your drive train if you want more of an honest comparison.
Respectfully,
E
Last edited by EricMeyer; Jul 11, 2008 at 07:14 AM.
Thread Starter
My 8 looks like a Smurf
iTrader: (4)
Joined: Sep 2007
Posts: 1,742
Likes: 2
From: Ottawa, ON, Canada
MT
Torque is the blue (black) line. I think it looks wrong because of the scaling.
Totally agree. I'm gonna try to get a reprint.
Where is the torque plot on your graph? If it's the black line there's something wierd going on. The torque curve should be flat at around 140 ftlbs from 5K to 8K or so and then start to tail off a bit. Both of these lines climb with RPM. This looks like two power curves side by side. Not a power and torque curve. The black line looks wrong.
Totally agree. I'm gonna try to get a reprint.


Thread
Thread Starter
Forum
Replies
Last Post
05rx8mazda
RX-8 Parts For Sale/Wanted
18
Nov 28, 2015 09:42 AM
Learners_Permit
Series I Interior, Audio, and Electronics
8
Sep 27, 2015 07:38 PM