
NASA PT/TT thread


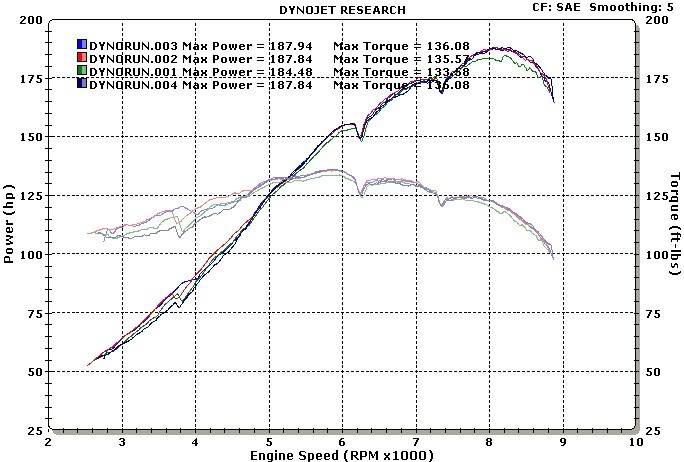
If you ever dyno your car you'll realize that shifting at 9500 is absolutely pointless and that you are putting less power to the ground by doing it and just creating excess heat and excess wear while going slower.These cars fall flat on their face at around 8500. It's simple math to calculate power under the curve through a certain gear.
my peak is 9000 and it doesn't fall off anywhere near as much as the OE curve
I would suggest using actual datalogging over a dyno regardless for accuracy under real conditions. Generally speaking, a dyno is a fixed load device that doesn't approximate real world acceleration through the gears with an ever increasing aero load, ect.
back on the clutch subject, I didn't really consider the sintered iron discs and wasn't familiar with their greater TQ capacity compared to other material options. Also, the reason I steered away from QM is my frustration trying to find information details on them as compared to other suppliers. So a 2-disc setup makes sense in your case. Sorry for mistaking this.

not entirely true depending on the engine mods and overall setup
my peak is 9000 and it doesn't fall off anywhere near as much as the OE curve
I would suggest using actual datalogging over a dyno regardless for accuracy under real conditions. Generally speaking, a dyno is a fixed load device that doesn't approximate real world acceleration through the gears with an ever increasing aero load, ect.
Also, while MAF is not WHP, the correlation is strong for a constant AFR. You can see the nuances in valve-openings in the data I posted earlier. There is an average of 4 lbs/min (15%) airflow improvement over 500rpm by shifting later. The correct shift point is approximately the intersection of each gears' power curve on a power vs velocity graph. When they don't intersect, shifting at redline is appropriate.
Last edited by cwatson; Oct 23, 2013 at 05:24 PM.

back on the clutch subject, I didn't really consider the sintered iron discs and wasn't familiar with their greater TQ capacity compared to other material options. Also, the reason I steered away from QM is my frustration trying to find information details on them as compared to other suppliers. So a 2-disc setup makes sense in your case. Sorry for mistaking this.
MAF flow can be misleading. I pull peak MAF flow at 10k, but obviously power and torque is well on the decline then
You really need acceleration rate data to determine the proper shift points.
.
You really need acceleration rate data to determine the proper shift points.
.

While it is true that power drops off about 9000rpms (or earlier on a stock motor) that doesn't mean that having the extra rpms doesn't help. When racing sometimes it's great to be able to not have to shift if you're trying to get past someone or if the braking zone is right about where you'd be upshifting anyway. I frequently run my motors to 9500 rpms or more with no apparent adverse effects.

Agreed. I've always found the best way to extract WHP from road data is to assume a curve shape and correlate to a velocity vs time over 2+ seconds. Below is data from a morning session, showing the uncertainty in estimating power from instantaneous acceleration data. P=FV = (M*Ax+D)*V. GPS dV/dt was used for Ax. Drag assumptions are on the left. Elevation change was not considered. Only data with >95% throttle was considered. Data was binned in 1 lb/min intervals and the statistics are stdev (67%) for the big bars and standard error (stdev/sqrt(n)) for the small bars.
Last edited by cwatson; Oct 23, 2013 at 11:07 PM.
You are playing theoretical games based on incorrect assumptions. I don't even want to waste my time on pointing it out to you any more, let alone try to understand where you come up with this stuff or are attempting to do.
To review:
The question is whether or not it is good to shift at redline.
First plot I showed demonstrates clearly higher airflow by shifting later.
Statements were made that MAF does not correlate to WHP.
I plotted MAF vs WHP showing a correlation but large uncertainty.
You pointed out that all we really need to look at is acceleration in one gear vs another at the same speed, which I am working to generate but worried the data will be hard to interpret without heavy filtering.
Can you provide track data that confidently shows the difference in forward acceleration between two adjacent gears at the same speed? I forgot to log RPM for the weekend so I can't use the standard method to back out gear. I'll have acceleration data vs gear plotted once I sort that out. However, it's going to be hard to read without some additional filtering. Also, samples were not taken at standard intervals (Track Addict logs everything it sees 5-600Hz) which would have to be considered when applying a filter.
I'm thinking the easiest thing would be to some acceleration pulls with different shift points and overlay the velocity data.
Last edited by cwatson; Oct 24, 2013 at 09:47 AM.
My prior reply is poorly worded as usual. It doesn't make sense to me why you are doing it this way, nor does it seem at all correct in concept, but it is certainly your prerogative to do so.
Please be more specific, what is "it"? If I have a concept wrong, I would like to understand why. I originally intended to plot speed vs power to determine shift points but only had clean flow data available, so I looked at that. Yes, flow is not a direct measurement, but it is a good indication of power. I've agreed that we really want to know the acceleration in different gears at the same speed, and am working to get that data but concerned it won't be readable. Please explain the method you would take to determine the correct shift points from track data.
Last edited by cwatson; Oct 24, 2013 at 03:24 PM.
Please be more specific, what is "it"? If I have a concept wrong, I would like to understand why. I originally intended to plot speed vs power to determine shift points but only had clean flow data available, so I looked at that. Yes, flow is not a direct measurement, but it is a good indication of power. I've agreed that we really want to know the acceleration in different gears at the same speed, and am working to get that data but concerned it won't be readable. Please explain the method you would take to determine the correct shift points from track data.
Not sure what you don't understand about this? It accomplishes exactly what you are trying to do theoretically with actual direct data instead. This is for general accel shifting. As Magnus pointed out there are times when you need to deviate from may be optimal for competitive strategy.

Registered
Joined: May 2003
Posts: 1,382
Likes: 11
isn't acceleration just gain in speed over time? why not just graph rpm, which is automatically over time = acceleration. we don't care about the airflow, we care about power.
simple is better sometimes, especially since we kind of know where the power is, and aren't always going to be shifting there anyways.
this one time at the 25 we put a a steering angle sensor, and brake pressure sensor in the car, so in addition to RPM, gps, yaw, etc etc, we thought we could overlay our drivers data on top of each other and find "the perfect lap"
the problem of course is that the track has width, and a so the length of the lap varies, and if each lap varies, the data doesn't line up, and this is in addition to variations in braking and turn in and stuff.
we sent the truck around infineon/sears point/sonoma raceway and found out that driving on the inside vs the outside is like 1/8th of a mile difference in length, which is where the variation comes from, the laps ARE different lengths.
the engineering dept went to look at textbooks, and found that they are really thick and written people have whole careers analyzing this kind of data, i talked to a rocket scientist and he told me this was the same problem that they had on the saturn 5 rockets guidance system.
with data you can get way over your head really quickly, and we've scaled it back a bit and we look at the braking into turn in, into acceleration now, smaller stuff, and we can do it in the pits without a team of people in lab coats.
it has to be analyzed on a differential mathematics level which is not so simple in reality depending on how accurate your datalogging is
an accelerometer will make your life much easier, you just need a long enough straight to determine the overlap rpm points between each set of consecutive gears
an accelerometer will make your life much easier, you just need a long enough straight to determine the overlap rpm points between each set of consecutive gears
Registered
Joined: May 2003
Posts: 1,382
Likes: 11
it has to be analyzed on a differential mathematics level which is not so simple in reality depending on how accurate your datalogging is
an accelerometer will make your life much easier, you just need a long enough straight to determine the overlap rpm points between each set of consecutive gears
an accelerometer will make your life much easier, you just need a long enough straight to determine the overlap rpm points between each set of consecutive gears

i always forget some mundane detail
-michael bolton

EDIT: just looking at a couple of my own plots, I am shifting 3->4 at ~8600 rpm and the optimal shift point looks like it is a slightly higher rpm than that. Car is stock, but no cat so might have slightly higher relative top end power compared to a 100% stock engine.
Last edited by blu3dragon; Oct 29, 2013 at 01:19 PM.
simple, yet inaccurate
especially if using a Cobb AP. There is a lot of lag on it's data capability. Often the data on the same line is not really all on the same time increment even though the log indicates that it is.
especially if using a Cobb AP. There is a lot of lag on it's data capability. Often the data on the same line is not really all on the same time increment even though the log indicates that it is.
Didn't know that about the Cobb AP. I'm not using one, but even if I was I'm only suggesting use of a single channel (speed) so lag should not matter anyway.
Oh, and looking at a graph of speed vs time is the same as looking at acceleration data so I think we're in agreement anyway


Registered
Joined: Nov 2004
Posts: 4,866
Likes: 4
From: Buford, GA USA
Sorry to hear that. Been there, done that! Completed the warm-up lap, past the start finish and exit of T-2 I lost the engine. So I can understand your pain. That weekend cost a lot of money.
EC is such a lousy track layout too, but if she's gonna blow then that 's the place it will happen since its pretty much just a series of drag strip straights connected by tight turns. I'm a bit shocked you'd drive all that way to run there.