Statistical Analysis Approach to Understanding MPG Issue
 10-23-2003, 08:42 AM
#1
Registered User
Thread Starter

Join Date: Aug 2003
Location: Central Jersey
Posts: 42
Likes: 0
Received 0 Likes
on
0 Posts
I know this MPG topic has been beaten to death, and I apologize for bringing it up again, however I would like to propose a new approach to understanding this MPG issue. I am not an RX-8 owner (yet), but have been following this forum for quite a while. Like many others, I too am interested in trying to understand the cause of great variation in mpg among RX-8 owners as well as relatively low mpg in many cases. (I have a daily commute of 85 miles).
It is very possible that there may be a combination of several factors causing this MPG situation. There is a type of quantitative analysis called Multivariate Regression which takes multiple factors into consideration and calculates their relative importance in determining an outcome, in this case, mpg. I�d be happy to conduct the analysis as a fellow RX-8 supporter. I just need as many RX-8 owners as possible to answer the survey below.
Based on my prior forum reading, I�ve come up with a several potential factors impacting the mpg. We�ll have to keep the responses very simple and straightforward. (Answers as explanations won�t work). Please participate��..
1. RECENT Combined City/Highway Average MPG = ___________
(Calculated Correctly and One Number please, not a range)
2. % Highway Driving = ______
3. Driving Style =
A. Easy going (Don�t normally use high rpm range, only occasionally)
B. Average,
C. Above Avg (Use Upper RPM range quite often and accelerate hard)
4. VIN Number (last 6 digits) = ___________
(NOTE: If you already entered your VIN on the thread �Let's compare VIN numbers and fuel economy�, I can get it from that thread).
5. Model (eg. Base, GT, etc) = ___________
6. Automatic / 6 speed = _____________
7. Octane (Number) of Fuel Used = ____________
8. DSC/TCS = Yes / No(Don�t Have or Fully Disabled)
9. Miles to Date = ___________
10. Approximate % Time Driving with Windows Open = ___________
11. Approximate % Time Driving with AC on = ___________
12. State = ______________
(I�ll later convert to Geographic Region)
Hope like hell I didn�t miss anything. I know this will be a pain � that many people have already responded to many threads regarding mpg. However it is very difficult to test one theory (eg. VIN # or Octane), when so many other contributing factors may also come into play. The analysis I am proposing takes all these factors into consideration simultaneously and identifies those which are important in determining mpg. If you are interested please respond. If you are not interested, well, please also respond���the more observations the better. I�ll post the results soon after receiving enough observations. For those that want to flame, hey, it�s my first post � have fun.
IMPORTANT: When responding, please complete all entries. If one thing is missing, such as Octane, then your entire response cannot be used. Thanks in advance for participating.
mod edit: results thread https://www.rx8club.com/showthread.p...4&page=1&pp=15

 10-23-2003, 09:42 AM
#3
Certified track junky!!!

Join Date: Feb 2003
Location: Lebanon, NH
Posts: 1,268
Likes: 0
Received 0 Likes
on
0 Posts
1. 16.8 MPG
2. 40%
3. C
4. 101102
5. GT
6. 6 speed
7. 93
8. Yes
9. 8400
10. 0%
11. 25%
12. NH
Observation: This only reflects my milage for my last fill-up. When I'm traveling my mileage increases significantly due to all of the time spent on the highway (20-24 MPG). Likewise I have seen horrible fuel economy on track days (7.5 MPG) or when I have been fooling around (13 MPG). Will this variation skew your results?
Last edited by Speed Racer; 10-23-2003 at 09:47 AM.
10-23-2003, 09:50 AM
#5
M0D Squad -charter member
Join Date: Jan 2003
Location: Alabama
Posts: 1,498
Likes: 0
Received 0 Likes
on
0 Posts
1. RECENT Combined City/Highway Average MPG = 22
(Calculated Correctly and One Number please, not a range)
2. % Highway Driving = 85%
3. Driving Style = B
A. Easy going (Don�t normally use high rpm range, only occasionally)
B. Average,
C. Above Avg (Use Upper RPM range quite often and accelerate hard)
4. VIN Number (last 6 digits) = 101212
5. Model (eg. Base, GT, etc) = GT
6. Automatic / 6 speed = 6 Sp
7. Octane (Number) of Fuel Used = 91
8. DSC/TCS = Yes
9. Miles to Date = 4800
10. Approximate % Time Driving with Windows Open = 10%
11. Approximate % Time Driving with AC on = 5%
12. State = AL
(I�ll later convert to Geographic Region)
10-23-2003, 10:00 AM
#7
Registered User
Thread Starter
Join Date: Aug 2003
Location: Central Jersey
Posts: 42
Likes: 0
Received 0 Likes
on
0 Posts
Speed Racer: Regarding your concern about skewing the results. As long as your responses to the questions regarding % Highway and Driving Style (?'s 2 and 3) are based on RECENT driving (in accordance with your RECENT avg. mpg), I believe the results should be o.k.
10-23-2003, 10:08 AM
#8
Registered User
Thread Starter
Join Date: Aug 2003
Location: Central Jersey
Posts: 42
Likes: 0
Received 0 Likes
on
0 Posts
JDL is correct:
PLEASE NOTE: As JDL stated; All responses should be specifically related to the 'recent MPG' answer to question 1.
ie. % highway driving, etc. should be based on RECENT driving.
PLEASE NOTE: As JDL stated; All responses should be specifically related to the 'recent MPG' answer to question 1.
ie. % highway driving, etc. should be based on RECENT driving.
10-23-2003, 11:13 AM
#9
Registered User

Join Date: Oct 2003
Posts: 139
Likes: 0
Received 0 Likes
on
0 Posts
Here's another take on the issue. What if the speedo's are.."optomistic"? say 1.5 mph off. That would reduce the MPG. I think before you can establish a baseline. You need to use another method of calculation. If the speedo's are at fault, then all the data collection in the world will not show a thing.
my .02 yen
my .02 yen
 10-23-2003, 11:52 AM
#11
Registered User
Thread Starter
Join Date: Aug 2003
Location: Central Jersey
Posts: 42
Likes: 0
Received 0 Likes
on
0 Posts
"What if the speedo's are.."optomistic"? say 1.5 mph off. That would reduce the MPG. I think before you can establish a baseline. You need to use another method of calculation. If the speedo's are at fault, then all the data collection in the world will not show a thing."
Good point Matt. I have a couple comments in response.
1. If the speedos are optimistic 1.5 mph, I believe that would actually yield a higher mpg, thus reducing the problem people seem to be having. For example, if the speedo read 50 mph too high, then the odometer reading would show much higher mileage, thus yielding a terrific MPG.
2. One of the goals of my proposed analysis was to better understand the great variation in MPG among RX-8 owners. If everyones speedo reads 1.5 mph too high, then everyone is impacted the same. Though the MPG results for everyone would be a tad bit higher than reality, it would not cause variation in MPG among owners.
3. I'm assuming the optimistic 1.5 mph reading occurs at roughly 60 mph. That equates to a 2.5% error, or similarly, for someone getting 20 mpg equates to 1/2 mpg. This is not near enough to muddy the results of the analysis.
10-23-2003, 12:03 PM
#12
Registered User

Join Date: Jan 2003
Location: Memphis, TN
Posts: 660
Likes: 0
Received 0 Likes
on
0 Posts
1. 21.35 MPG
2. 85%
3. B
4. 101129
5. touring
6. 6 speed
7. 92
8. No
9. 7800
10. 5%
11. 2%
12. MD
another part of driving style that may be important is average speed / or normal cruising speed. mine is probably average 72, usually in the 75 +/- 5 range. Sometimes 68, less some times in the 90s. I'm not sure how my throttle use is as an 'average'. in town driving it's very easy going,1200RPM starts. usually. Then there's a hopefully daily 9K redline short burst. My fuel buying was 87 for several tanks; the last 4 have been premium. The MPG figure I gave is the last tank which was on the 3rd full premium tank since switching back from 87. Our local temps have been in the 45-60 range mostly recently. Running close to 32PSI; 5w/20 oil, usually no passenger or extra luggage -all possible factors as well.
10-23-2003, 12:56 PM
#13
Registered User

Join Date: Sep 2003
Location: Florida
Posts: 572
Likes: 0
Received 0 Likes
on
0 Posts
1. RECENT Combined City/Highway Average MPG = 18.3
2. % Highway Driving = 10%
3. Driving Style = B
4. VIN Number (last 6 digits) = 106908
5. Model (eg. Base, GT, etc) = GT
6. 6 speed
7. Octane (Number) of Fuel Used = 91
8. DSC/TCS = Disabled (DSC off, but no squiggly lines)
9. Miles to Date = 1500
10. Approx % Time Driving with Windows Open = 0%
11. Approximate % Time Driving with AC on = 98%
12. State = Florida
How about adding spoiler/no spoiler and front lip/no lip?
But there are more variables to consider: Ambient temps, humidity, length of traffic lights (here in Tampa bay, some red lights are 3 minutes long), amount of time idling, Hills/no hills,
average MPH...just to name a few
Last edited by 6speed8; 10-23-2003 at 01:01 PM.

 10-23-2003, 02:48 PM
#16
just jd.

Join Date: May 2003
Location: San Diego, California
Posts: 182
Likes: 0
Received 0 Likes
on
0 Posts
another data question
norton, will your statistical analysis support multiple data sets per VIN?
I can imagine over time folks will have additional data for recent MPG calcs, perhaps with dramatically different driving styles, all-freeway, no-freeway, etc... I have several such data sets already.
Another data point you might want to include, then, is the rough #miles on the vehicle at the time of the data set. Perhaps just to differentiate the sets per VIN, or track another correlation to "new car break-in".
My motivation: well, for my break-in I took a 1200 mile road trip, yielding 22.58 mpg, which stands as my car's all-time best. I know the car's capable of doing 22+ mpg, but my last many tanks have settled more in the 14 mpg range. Clearly there a large range of data for each car.
Cheers,
-jd.
 10-23-2003, 02:52 PM
#18
Registered User
Thread Starter
Join Date: Aug 2003
Location: Central Jersey
Posts: 42
Likes: 0
Received 0 Likes
on
0 Posts
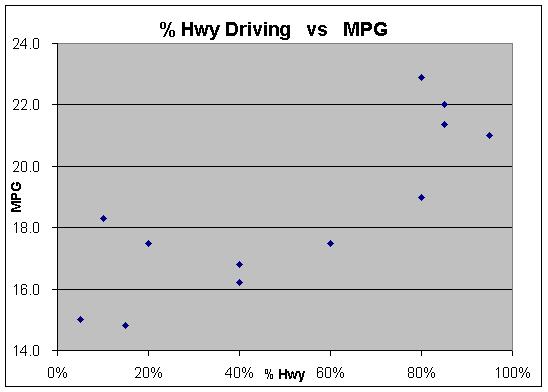
I don't yet have enough observations to conduct the analysis, however I did notice one interesting thing while taking a quick look at the few observations so far. Looking at MPG and % Hwy, there appears a definite pattern. This is not too surprising, however I don't know if this has been clearly shown before.
I'm trying to attach or insert a small graph (JPEG) I made of MPG vs % Hwy, however with my lack of posting knowledge, have not had success yet. Any help??
Here's another try.......
I'm trying to attach or insert a small graph (JPEG) I made of MPG vs % Hwy, however with my lack of posting knowledge, have not had success yet. Any help??
Here's another try.......
10-23-2003, 03:08 PM
#19
Registered User
Thread Starter
Join Date: Aug 2003
Location: Central Jersey
Posts: 42
Likes: 0
Received 0 Likes
on
0 Posts
JDL "will your statistical analysis support multiple data sets per VIN?"
Well, kind of. It would be fine and is probably a good idea to get multiple data sets over time. The only thing is that it somewhat dilutes the impact of measuring VIN as a potential MPG impacting factor.
"Another data point you might want to include, then, is the rough #miles on the vehicle at the time of the data set"
If I am interpreting your suggestion properly, I believe this information is captured in Question 9, (Miles to Date).
Thanks for the input.
It really sucks barely knowing how to use the posting capability. As you can tell, I'm a greenhorn to forumland posting.
10-23-2003, 03:38 PM
#20
just jd.
Join Date: May 2003
Location: San Diego, California
Posts: 182
Likes: 0
Received 0 Likes
on
0 Posts
Originally posted by norton
JDL "will your statistical analysis support multiple data sets per VIN?"
[...]
"Another data point you might want to include, then, is the rough #miles on the vehicle at the time of the data set"
If I am interpreting your suggestion properly, I believe this information is captured in Question 9, (Miles to Date).*snip*
``Perhaps just to differentiate the sets per VIN, or track another correlation to "new car break-in".''
So I was suggesting you might use odometer readings to distiguish one data set from another for the same VIN.
I believe you can still find the VIN correlation, if it exists, from multiple data sets. In fact, more so, since you may have the same VIN with significanty varied (other) conditions.
Anyhoo, I'll hold off until you say when you'd like more data sets (per VIN)... -jd.
10-23-2003, 03:52 PM
#21
Registered User
Join Date: Apr 2003
Location: plantation Fl
Posts: 758
Likes: 0
Received 0 Likes
on
0 Posts
hope this helps. i have a appointment with mazda about my fuel consumption.
1. RECENT Combined City/Highway Average MPG = 19
2. % Highway Driving = 80%
3. Driving Style = B
4. VIN Number (last 6 digits) = 102274
5. Model (eg. Base, GT, etc) = GT
6. 6 speed
7. Octane (Number) of Fuel Used = 93(shell)
8. DSC/TCS = on
9. Miles to Date = 6300
10. Approx % Time Driving with Windows Open = 95%
11. Approximate % Time Driving with AC on = 5%
12. State = Florida
10-23-2003, 05:44 PM
#22
<p><

Join Date: May 2003
Posts: 693
Likes: 0
Received 0 Likes
on
0 Posts
Originally posted by norton
I'm trying to attach or insert a small graph (JPEG) I made of MPG vs % Hwy, however with my lack of posting knowledge, have not had success yet. Any help??
I'm trying to attach or insert a small graph (JPEG) I made of MPG vs % Hwy, however with my lack of posting knowledge, have not had success yet. Any help??
1. Create a post. On the "Attach File:" row, click on the Browse button.
2. Select your .jpg file and click ok.
3. Submit your post.
Just make sure your .jpg is below 204k.
10-23-2003, 05:54 PM
#23
Registered User

Join Date: Sep 2003
Location: San Francisco Bay Area
Posts: 493
Likes: 0
Received 0 Likes
on
0 Posts
1. RECENT Combined City/Highway Average MPG = 21 mpg
2. % Highway Driving = 95%
3. Driving Style = A
4. VIN Number (last 6 digits) = 109161
5. Model (eg. Base, GT, etc) = GT
6. Automatic / 6 speed = 6 Sp
7. Octane (Number) of Fuel Used = 87
8. DSC/TCS = Yes
9. Miles to Date = 2500
10. Approximate % Time Driving with Windows Open = 3%
11. Approximate % Time Driving with AC on = 0%
12. State = CA
10-23-2003, 07:23 PM
#24
Registered User

Join Date: Apr 2003
Location: Pomona, CA
Posts: 205
Likes: 0
Received 0 Likes
on
0 Posts
1. RECENT Combined City/Highway Average MPG = 19
2. % Highway Driving = 30%
3. Driving Style = Average
4. VIN Number = 102058
5. Model = GT
6. 6 speed
7. Octane (Number) of Fuel Used = 87
8. DSC/TCS = Yes
9. Miles to Date = 5300
10. Approximate % Time Driving with Windows Open = 10%
11. Approximate % Time Driving with AC on = 99%
12. State = CA
2. % Highway Driving = 30%
3. Driving Style = Average
4. VIN Number = 102058
5. Model = GT
6. 6 speed
7. Octane (Number) of Fuel Used = 87
8. DSC/TCS = Yes
9. Miles to Date = 5300
10. Approximate % Time Driving with Windows Open = 10%
11. Approximate % Time Driving with AC on = 99%
12. State = CA
10-23-2003, 07:41 PM
#25
Registered User
Thread Starter
Join Date: Aug 2003
Location: Central Jersey
Posts: 42
Likes: 0
Received 0 Likes
on
0 Posts
Downshift - Thanks for the posting tip. Hopefully it will work this time.
Once again --- I don't yet have enough observations to conduct the complete analysis, however I did notice one interesting thing while taking a quick look at the few observations so far. Looking at MPG and % Hwy, there appears a definite trend. This is not too surprising, however I don't know if this has been clearly shown before with % Hwy vs MPG. Please take a look at the graph (if I posted it correctly this time).
Once again --- I don't yet have enough observations to conduct the complete analysis, however I did notice one interesting thing while taking a quick look at the few observations so far. Looking at MPG and % Hwy, there appears a definite trend. This is not too surprising, however I don't know if this has been clearly shown before with % Hwy vs MPG. Please take a look at the graph (if I posted it correctly this time).