RESULTS: Statistical Analysis of MPG -- Long
#1
Registered User
Thread Starter
Join Date: Aug 2003
Location: Central Jersey
Posts: 42
Likes: 0
Received 0 Likes
on
0 Posts
RESULTS: Statistical Analysis of MPG -- Long
REGRESSION ANALYSIS RESULTS:
Iíve had a couple glasses of vodka and pressed a few buttons on the laptop. The Regression Analysis for the set of data is complete. Thank you everyone for contributing and for your suggestions. The results are as follows:
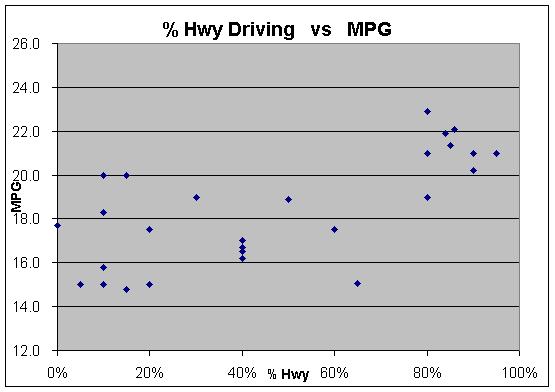
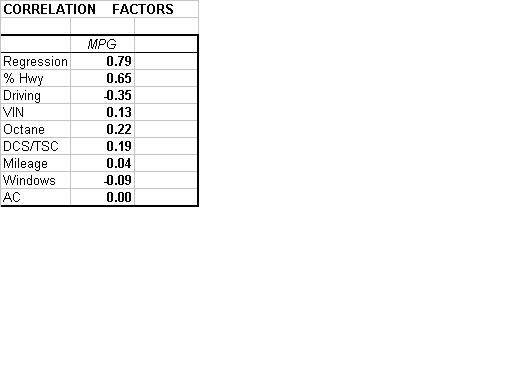
In a nutshell, based on the data provided, the only substantial variables impacting MPG are % Hwy and Driving Style. Yielding an overall Correlation of 79%, this means that these two factors, when combined, explain about 2/3 of the variance between average MPG among RX-8 owners. Relatively speaking, thatís actually very good. Other factors such as using AC, windows open, and Octane also impact MPG, though to a much lesser magnitude. The other variables providedÖÖÖ.no such luck. Model and Tranny I could not use because almost everyone has the 6-Speed GT. One comment regarding Miles to Date. As a particular owner adds miles on their car, it certainly appears that their individual MPG increases, from what Iíve read on other threads. However, when looking across many owners, it is NOT readily apparent that those with fewer miles get worse MPG than those with more miles on their cars. It tends to get washed out by the other, more significant variables. Please see below for the Correlations associated with each of the inputs you provided relative to MPG. The first Correlation factor of 79% for ďRegressionĒ is the correlation resulting from including the both % Hwy and Driving Style simultaneously. Also, shown below is an updated MPG vs % Hwy graph
mod edit : data gathering and discussion thread https://www.rx8club.com/showthread.p...915#post149915
Iíve had a couple glasses of vodka and pressed a few buttons on the laptop. The Regression Analysis for the set of data is complete. Thank you everyone for contributing and for your suggestions. The results are as follows:
In a nutshell, based on the data provided, the only substantial variables impacting MPG are % Hwy and Driving Style. Yielding an overall Correlation of 79%, this means that these two factors, when combined, explain about 2/3 of the variance between average MPG among RX-8 owners. Relatively speaking, thatís actually very good. Other factors such as using AC, windows open, and Octane also impact MPG, though to a much lesser magnitude. The other variables providedÖÖÖ.no such luck. Model and Tranny I could not use because almost everyone has the 6-Speed GT. One comment regarding Miles to Date. As a particular owner adds miles on their car, it certainly appears that their individual MPG increases, from what Iíve read on other threads. However, when looking across many owners, it is NOT readily apparent that those with fewer miles get worse MPG than those with more miles on their cars. It tends to get washed out by the other, more significant variables. Please see below for the Correlations associated with each of the inputs you provided relative to MPG. The first Correlation factor of 79% for ďRegressionĒ is the correlation resulting from including the both % Hwy and Driving Style simultaneously. Also, shown below is an updated MPG vs % Hwy graph

mod edit : data gathering and discussion thread https://www.rx8club.com/showthread.p...915#post149915
#3
Registered User
Thread Starter
Join Date: Aug 2003
Location: Central Jersey
Posts: 42
Likes: 0
Received 0 Likes
on
0 Posts
MPG ESTIMATION:
One of the most important outputs of the Regression Analysis is an actual equation that can be used to estimate what someoneís MPG would be, based on their % Hwy and Driving Style. This can be very useful in a couple ways:
1. A current owner can assess, based on their % Hwy and Driving Style if they fall near the Estimated Mileage using the equation. If their MPG is far below the Estimate (say 2 MPG), then either their own estimates of % Hwy or Driving Style may be somewhat off, or some other factors not yet discovered may be coming into play.
2. For a non-RX8 owner who is contemplating getting the car, this Regression equation can be used to Estimate what their MPG might be, given their % Hwy and Driving Style.
Here is the Equation and an Example of how it works:
Estimated MPG = 18.23 + (5.22 * % Hwy) - (1.19 * Driving Style)
Note: For Driving Style ----- Use 1 instead of A, 2 instead of B, 3 instead of C
For someone Driving 80% Hwy with a Driving Style of B (2), the calculation would be
18.23 + (5.22 * 0.80) - (1.19 * 2) = 20.1 Estimated MPG
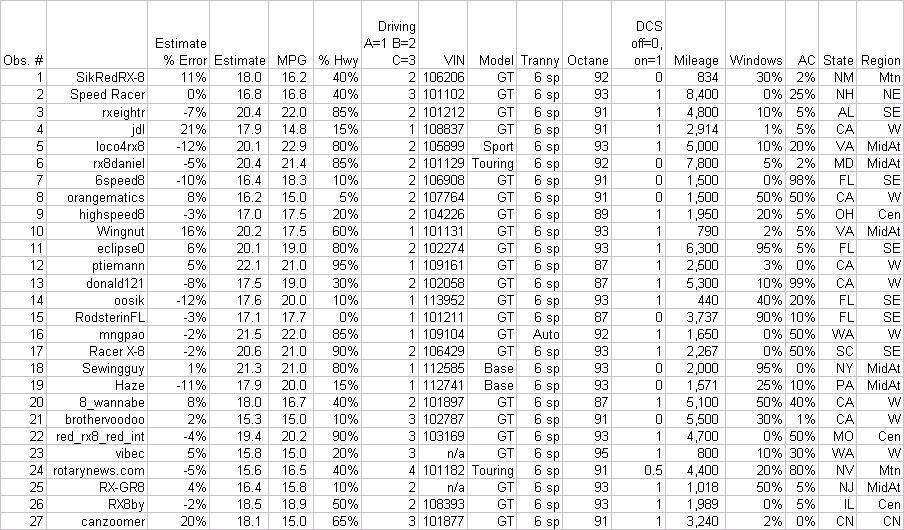
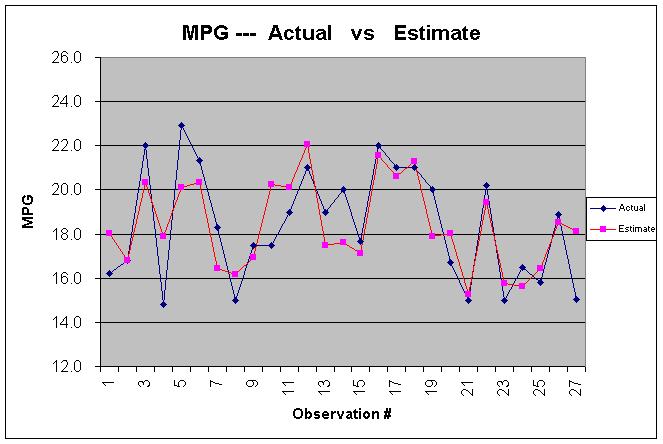
Below is a graph of each response Actual vs Estimated MPG. To see your data point, get your observation number from the raw data table below the graph.

#5
Registered User
Thread Starter
Join Date: Aug 2003
Location: Central Jersey
Posts: 42
Likes: 0
Received 0 Likes
on
0 Posts
One thing to note: Though it looks like % Hwy and Driving Style are the most important determinants of MPG, there certainly may be other variables related to driving conditions/habits which are worth considering. For example, the following have also been suggested:
- Average Highway Cruising Speed
- Average Speed (My favorite preference)
- Altitude
- Updated responses based on more mileage on the cars.
Avg Hwy Cruising Speed may be quite useful. As was pointed out, someone who cruises at 85 mph will get far less MPG than someone cruising at a constant 55 mph. The couple problems with this variable are that for many people (including me), itís hard to estimate an Avg Hwy Speed. I go anywhere from 55 Ė 85 depending on traffic, which may yield quite different MPG than someone who just travels at a constant 70 mph. Also, to estimate the average cruising speed would really be a rough ball park number.
I think using Average Speed would probably turn out be the most important variable. It involves NO subjective estimate, and is something which CAN actually be measured. Overall itís a much better proxy for City/Hwy % driving. One of the biggest problems using % Hwy that I have found while analyzing the data is that it is a subjective estimate, with no hard data behind it. When something is a judgment call, rather than actually measured, it introduces all kinds of problems and judgment error, thus reducing its effectiveness. (Thatís also one reason I only included 3 different categories for Driving Style rather than 5 or more).
There are definitely some outliers relative to the estimates, and there is certainly room for improvement. With this idea of improving the analysis, we have to consider a couple things:
1. The ease and feasibility of obtaining the new, reliable information.
2. At this point, people may be sick of this MPG dissection and want to put it to rest.
3. Amount of participation weíll get.
In conclusion, it looks like significantly improving MPG may be fairly difficult. Based on the data provided, the analysis shows MPG is mostly determined by driving conditions. The roads people drive on (traffic congestion, lights, etc) canít really be changed, and I would assume people donít really want to alter their driving style, especially with a car like the RX-8. If anyone has any comments on the analysis or further suggestions regarding understanding the drivers of MPG, Iíd really like to hear.
#6
Registered User
Thread Starter
Join Date: Aug 2003
Location: Central Jersey
Posts: 42
Likes: 0
Received 0 Likes
on
0 Posts
Interesting Finding:
One BIG outlier in the Actual vs Estimate Graph is the last observation (canzoomer). After doing a bit of forum reading a little while ago, I just discovered he's done some significant work on his engine. Both HP and Torque increased substantially. This is likely one major reason for canzoomer's Actual MPG so much less than the Estimated MPG. I was hoping there was some "external" factor unique to canzoomer's situation that would explain such a large deviation. Perhaps the power increase came at the cost of MPG
One BIG outlier in the Actual vs Estimate Graph is the last observation (canzoomer). After doing a bit of forum reading a little while ago, I just discovered he's done some significant work on his engine. Both HP and Torque increased substantially. This is likely one major reason for canzoomer's Actual MPG so much less than the Estimated MPG. I was hoping there was some "external" factor unique to canzoomer's situation that would explain such a large deviation. Perhaps the power increase came at the cost of MPG

#8
Lubricious
Join Date: Oct 2003
Location: SF Bay Area, California
Posts: 3,425
Likes: 0
Received 4 Likes
on
4 Posts
Originally posted by norton
MPG ESTIMATION:
2. For a non-RX8 owner who is contemplating getting the car, this Regression equation can be used to Estimate what their MPG might be, given their % Hwy and Driving Style.
Here is the Equation and an Example of how it works:
Estimated MPG = 18.23 + (5.22 * % Hwy) - (1.19 * Driving Style)
Note: For Driving Style ----- Use 1 instead of A, 2 instead of B, 3 instead of C
For someone Driving 80% Hwy with a Driving Style of B (2), the calculation would be
18.23 + (5.22 * 0.80) - (1.19 * 2) = 20.1 Estimated MPG
Below is a graph of each response Actual vs Estimated MPG. To see your data point, get your observation number from the raw data table below the graph.
Looks like a good correlation. Unfortunately, it does not correlate with the EPA estimates, which suggest a spread of 20-28(!) mpg highway. It seems to me their projections are about 4mpg too high. I wonder if they tested the vehicle before the detuned fuel maps or would be interested in retesting based on this data.
#9
Registered User
Join Date: Sep 2003
Location: delaware
Posts: 13
Likes: 0
Received 0 Likes
on
0 Posts
Norton,
This type of analysis is very hard to do with subjective data input such as percent highway driving and driving style. The results are surprisingly good. This looks like it was a "simple" linear correlation of the various factors, one at a time. Do you have any insight as to whether some factors are more important if they are entered as the square of the term, or a combination of factors? For example, the combination of driving style 3 and city driving may be much worse than highway driving and driving style 3. Is the data set good enough to support further analysis?
Ron
#10
Last edited by P00Man; 04-16-2011 at 08:39 PM.
#11
Registered User
Thread Starter
Join Date: Aug 2003
Location: Central Jersey
Posts: 42
Likes: 0
Received 0 Likes
on
0 Posts
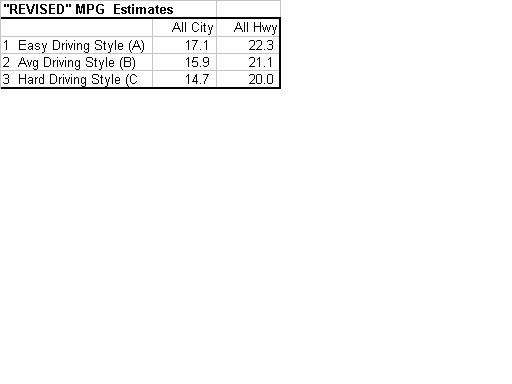
Nubo: You gave me an idea. Based on the regression analysis equation above, I've put together the resultant "REVISED" MPG Estimates. It's actually very simple algebra. Please see the little table below, at the bottom of this post:
**********************************************
Ron: I couldn't agree with you more regarding the subjective data. Per my comment above regarding subjective data, ............
Ron: The correlation, one factor at a time was only a minor aspect of the entire analysis. More enlightening, I believe, was the regression information which followed where multiple variables were assessed.
Ron: The square of the term I did not try.
I did try a combination of variables. In fact, in the Multivariate Regression analysis, I first started with all the various inputs everyone gave me, looking at them simultaneously. Then I weeded out those variables which were not too significant, and was left with % Hwy and Driving Style as important to determining MPG.
Per your question regarding your example, please see the little table below. I believe the regression model addresses exactly the scenario you describe.
Ron: Well, it's pretty good data. I was hoping to have another 10-20 observations. It would have helped reduce the impact of the few outliers. Also, there is the shortcoming of the subjective data. I suppose there's more that could be done with the data, though I'm not sure what people would want to see/try.
**********************************************
This type of analysis is very hard to do with subjective data input such as percent highway driving and driving style.
This looks like it was a "simple" linear correlation of the various factors, one at a time.
Do you have any insight as to whether some factors are more important if they are entered as the square of the term, or a combination of factors? For example, the combination of driving style 3 and city driving may be much worse than highway driving and driving style 3. Is the data set good enough to support further analysis?
I did try a combination of variables. In fact, in the Multivariate Regression analysis, I first started with all the various inputs everyone gave me, looking at them simultaneously. Then I weeded out those variables which were not too significant, and was left with % Hwy and Driving Style as important to determining MPG.
Per your question regarding your example, please see the little table below. I believe the regression model addresses exactly the scenario you describe.
Is the data set good enough to support further analysis?

#14
Pro Audentius
Originally posted by norton
Ron: Well, it's pretty good data. I was hoping to have another 10-20 observations. It would have helped reduce the impact of the few outliers. Also, there is the shortcoming of the subjective data. I suppose there's more that could be done with the data, though I'm not sure what people would want to see/try.
Ron: Well, it's pretty good data. I was hoping to have another 10-20 observations. It would have helped reduce the impact of the few outliers. Also, there is the shortcoming of the subjective data. I suppose there's more that could be done with the data, though I'm not sure what people would want to see/try.
Second, it occurs to me you could simply revisit the topic occasionally to collect more inputs as time goes by and accumulated milage increases. When I get an 8 in another few months, and after I've collected some observations, I'll certainly volunteer some data...
Finally, along the lines of using "cruising speed" as a factor, I think you're suspicions are correct. In every car I've owned, I've noted a strong correllation to MPG and speed... on a tank of gas, I've noted probably on the order of 2-3 MPG, depending on my adherence to the speed limits :D
#15
Registered User
Thread Starter
Join Date: Aug 2003
Location: Central Jersey
Posts: 42
Likes: 0
Received 0 Likes
on
0 Posts
SpacerX:
Sure, I would be very happy to occasionally rerun the model based on new data. If anyone wants to update their response after more mileage has accumulated on their car, please do so. Or, if anyone wants to provide data for the first time, that's fine too. Rerunning and updating everything is a relatively easy job now that the analytical infrastructure is in place........ basically two glasses of vodka, one joint, and a few computer keys to press.
All in all, at this point I feel comfortable that we have determined a couple things, though not too surprising:
1. GrandMa driving improves mileage.
2. Boring highway driving yields the best mileage.
This is true among any car, though perhaps more so with the RX-8. I think the interesting thing is that no other factors were determined to be significant thus far.


