
D.I.Y. Datalog / Graph your AP with EFI Dude/Scanalyser


Here is my first contribution. This spreadsheet will sort your data into a table so you can more easily get a picture of whats going on at more places then at WOT. I SUGGEST NOT GIVING THE INFO TO JEFF IN THIS FORMAT AS ITS NOT THE FORMAT HE'S ASKING FOR!!!
Simply drive around trying to hit as many rpm and load combinations as you can for as long as you want while logging the data you want to map out. Copy that data and paste into the "Input" tab in their respected column. Go back to the "Start" tab, verify the x,y and output options selected are what you want to use and hit the "Run Report" button.
...it may take a minute or two to run depending how much you logged and how fast your computer runs...
Last edited by r0tor; Oct 6, 2008 at 10:50 AM.

Thread Starter
Registered User
Joined: Jul 2007
Posts: 686
Likes: 0
From: Canada ---> Australia
 .
.i'm severly confused now

I'm not sure why some of you get the problems with downloading the file, and I'm unaware of any email problems at the moment. If you have been emailing me and I haven't responded, I'm sorry - please try to PM me and see where that takes us.
I'm working on a USB version of sCANalyser Live. Plus of course the supercharger and sCANalyser Pro Tuner...
Cheers,
Hymee.
I'm working on a USB version of sCANalyser Live. Plus of course the supercharger and sCANalyser Pro Tuner...
Cheers,
Hymee.

^^^ Hymee, I'm sure there will be threads about those down the road but since you brought it up: will those of us who have the scanalyser already have an easy (and inexpensive) way to upgrade software / hardware?
you can PM me if you like so we don't completely side track this thread. Thanks amigo.
you can PM me if you like so we don't completely side track this thread. Thanks amigo.
Thread Starter
Registered User
Joined: Jul 2007
Posts: 686
Likes: 0
From: Canada ---> Australia
I think the cobb/scannalyzer scales it...but other people have the same problem.

any one know how to use excell 2007 the above directions are not working at all. I thought i had it figured out but it looks like no. I'm having trouble making graphs where the data is legiable enough to make precise tunes. i.e. when i make a graph for AFR/RPM if the rpms go by 1000 then my afr goes by 5's leaving too much guess work as to where my afr is actually at and if I add data labels it's way too close and looks like a bunch of black jumbled numbers. Also if I open up a second excell program and try to copy the numbers info it paste it as numbers insted of graphing it like I have selected. So the only way I can get it to graph is by using the same excell page which will change my logged data I have saved thus removing all my information. Also i don't get how to use the tableviewer.
https://www.rx8club.com/showthread.php?t=155936
I think the cobb/scannalyzer scales it...but other people have the same problem.
I think the cobb/scannalyzer scales it...but other people have the same problem.

humm basically I just copied the entire cvs. file so all the data is there just not going in for some reason. the file is like 1500 lines long. maybe it's due to the load thing being weird my max load is 190.5882
completely befuddled with these Loads being reported... Are these all being reported from the EFIDude logger????
anyway, you can change the numbers in the blue column on the "start" page to something that works for you. So instead of the load column going from 0-106, it probably needs to go from 0-200 for you.
anyway, you can change the numbers in the blue column on the "start" page to something that works for you. So instead of the load column going from 0-106, it probably needs to go from 0-200 for you.


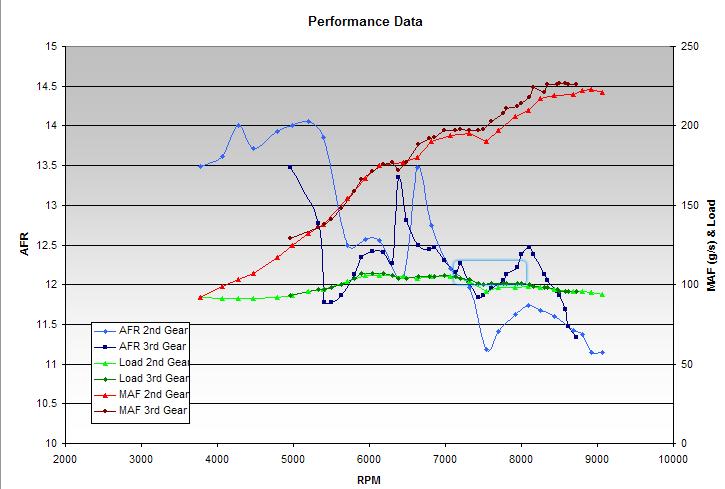
OK... I'm sharing a spreadsheet I just created to tune my AP myself. The spreadsheet will upload your AccessTuner Race csv file, will analyze the data to find the first 2nd gear and 3rd gear WOT pull, graph them, then allow you to export them to a new file for easy storage.
Step 1: Log at least: Load, Vehicle speed (VSS), RPM, Equivalence Ratio, and MAF. You can log more things, but not less...
Step 2: Safely do a WOT 2nd gear and 3rd gear run while logging. Your ecu has a 1-2 gear map and a 3-4 gear map. You'll want to see both obviously.
Step 3: Open the spreadsheet. Press the Import Data button. Find your csv file in your ATR directory. Open it... the spreadsheet will copy your csv file data into itself.
Step 4: Press the Analyze data button. The spreadsheet will look at the data, determine what gears you were in, finds the first 2nd and 3rd gear WOT pulls (looks for at least 10 log points above 89% throttle in the gear its looking for), and copies the pulls to another sheet linked to the graph called "graph data"
Step 5: Look at your results. If it missed the data or gathered the wrong data - copy the right data into the "graph data" sheet.
Step 6: Press the Export Data button. This will copy the graph and graph data to a new spreadsheet which you can save. Do not save over the original spreadsheet.... use it as a template!


Part of Windows setting I bet; you can customize how it stores and load percentages, decimals etc..
You can set an IIF("Percentage">1, LeaveAlone, Percentage * 100)
Something like that.
You can set an IIF("Percentage">1, LeaveAlone, Percentage * 100)
Something like that.