

RESULTS: Statistical Analysis of MPG -- Long


Thread Starter
Registered User
Joined: Aug 2003
Posts: 42
Likes: 0
From: Central Jersey
RESULTS: Statistical Analysis of MPG -- Long
REGRESSION ANALYSIS RESULTS:
I�ve had a couple glasses of vodka and pressed a few buttons on the laptop. The Regression Analysis for the set of data is complete. Thank you everyone for contributing and for your suggestions. The results are as follows:
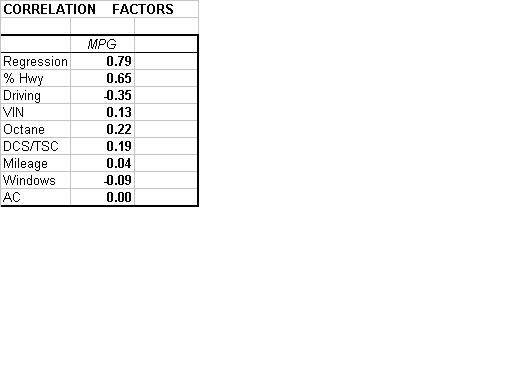
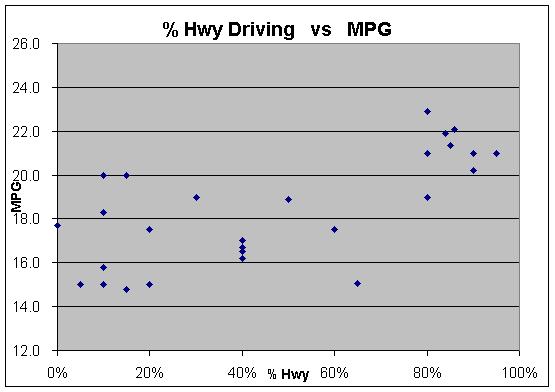
In a nutshell, based on the data provided, the only substantial variables impacting MPG are % Hwy and Driving Style. Yielding an overall Correlation of 79%, this means that these two factors, when combined, explain about 2/3 of the variance between average MPG among RX-8 owners. Relatively speaking, that�s actually very good. Other factors such as using AC, windows open, and Octane also impact MPG, though to a much lesser magnitude. The other variables provided���.no such luck. Model and Tranny I could not use because almost everyone has the 6-Speed GT. One comment regarding Miles to Date. As a particular owner adds miles on their car, it certainly appears that their individual MPG increases, from what I�ve read on other threads. However, when looking across many owners, it is NOT readily apparent that those with fewer miles get worse MPG than those with more miles on their cars. It tends to get washed out by the other, more significant variables. Please see below for the Correlations associated with each of the inputs you provided relative to MPG. The first Correlation factor of 79% for �Regression� is the correlation resulting from including the both % Hwy and Driving Style simultaneously. Also, shown below is an updated MPG vs % Hwy graph
mod edit : data gathering and discussion thread https://www.rx8club.com/showthread.p...915#post149915
I�ve had a couple glasses of vodka and pressed a few buttons on the laptop. The Regression Analysis for the set of data is complete. Thank you everyone for contributing and for your suggestions. The results are as follows:
In a nutshell, based on the data provided, the only substantial variables impacting MPG are % Hwy and Driving Style. Yielding an overall Correlation of 79%, this means that these two factors, when combined, explain about 2/3 of the variance between average MPG among RX-8 owners. Relatively speaking, that�s actually very good. Other factors such as using AC, windows open, and Octane also impact MPG, though to a much lesser magnitude. The other variables provided���.no such luck. Model and Tranny I could not use because almost everyone has the 6-Speed GT. One comment regarding Miles to Date. As a particular owner adds miles on their car, it certainly appears that their individual MPG increases, from what I�ve read on other threads. However, when looking across many owners, it is NOT readily apparent that those with fewer miles get worse MPG than those with more miles on their cars. It tends to get washed out by the other, more significant variables. Please see below for the Correlations associated with each of the inputs you provided relative to MPG. The first Correlation factor of 79% for �Regression� is the correlation resulting from including the both % Hwy and Driving Style simultaneously. Also, shown below is an updated MPG vs % Hwy graph
mod edit : data gathering and discussion thread https://www.rx8club.com/showthread.p...915#post149915
Thread Starter
Registered User
Joined: Aug 2003
Posts: 42
Likes: 0
From: Central Jersey
MPG ESTIMATION:
One of the most important outputs of the Regression Analysis is an actual equation that can be used to estimate what someone�s MPG would be, based on their % Hwy and Driving Style. This can be very useful in a couple ways:
1. A current owner can assess, based on their % Hwy and Driving Style if they fall near the Estimated Mileage using the equation. If their MPG is far below the Estimate (say 2 MPG), then either their own estimates of % Hwy or Driving Style may be somewhat off, or some other factors not yet discovered may be coming into play.
2. For a non-RX8 owner who is contemplating getting the car, this Regression equation can be used to Estimate what their MPG might be, given their % Hwy and Driving Style.
Here is the Equation and an Example of how it works:
Estimated MPG = 18.23 + (5.22 * % Hwy) - (1.19 * Driving Style)
Note: For Driving Style ----- Use 1 instead of A, 2 instead of B, 3 instead of C
For someone Driving 80% Hwy with a Driving Style of B (2), the calculation would be
18.23 + (5.22 * 0.80) - (1.19 * 2) = 20.1 Estimated MPG
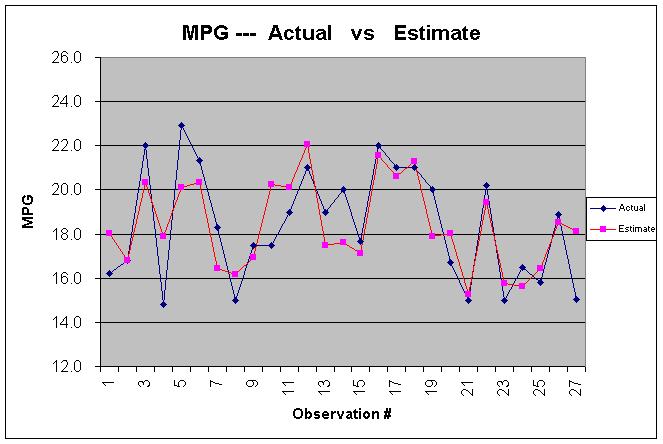
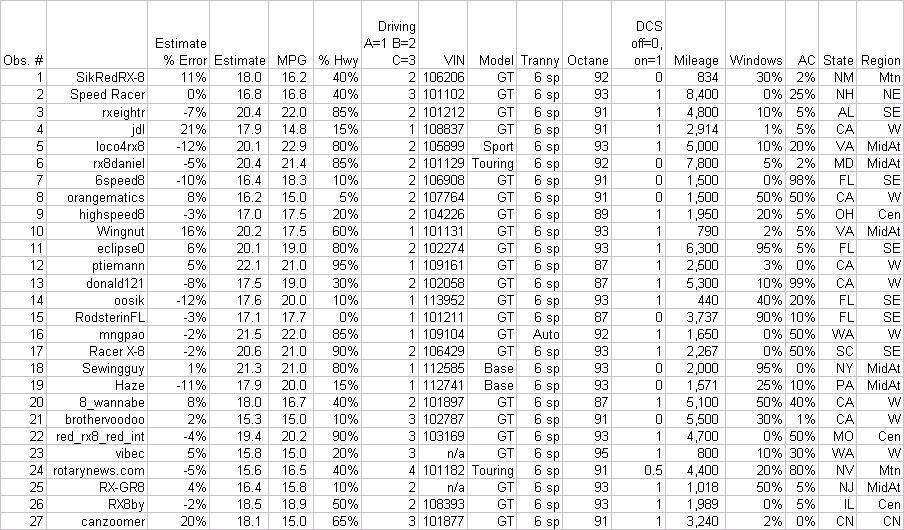
Below is a graph of each response Actual vs Estimated MPG. To see your data point, get your observation number from the raw data table below the graph.
One of the most important outputs of the Regression Analysis is an actual equation that can be used to estimate what someone�s MPG would be, based on their % Hwy and Driving Style. This can be very useful in a couple ways:
1. A current owner can assess, based on their % Hwy and Driving Style if they fall near the Estimated Mileage using the equation. If their MPG is far below the Estimate (say 2 MPG), then either their own estimates of % Hwy or Driving Style may be somewhat off, or some other factors not yet discovered may be coming into play.
2. For a non-RX8 owner who is contemplating getting the car, this Regression equation can be used to Estimate what their MPG might be, given their % Hwy and Driving Style.
Here is the Equation and an Example of how it works:
Estimated MPG = 18.23 + (5.22 * % Hwy) - (1.19 * Driving Style)
Note: For Driving Style ----- Use 1 instead of A, 2 instead of B, 3 instead of C
For someone Driving 80% Hwy with a Driving Style of B (2), the calculation would be
18.23 + (5.22 * 0.80) - (1.19 * 2) = 20.1 Estimated MPG
Below is a graph of each response Actual vs Estimated MPG. To see your data point, get your observation number from the raw data table below the graph.
Thread Starter
Registered User
Joined: Aug 2003
Posts: 42
Likes: 0
From: Central Jersey
One thing to note: Though it looks like % Hwy and Driving Style are the most important determinants of MPG, there certainly may be other variables related to driving conditions/habits which are worth considering. For example, the following have also been suggested:
- Average Highway Cruising Speed
- Average Speed (My favorite preference)
- Altitude
- Updated responses based on more mileage on the cars.
Avg Hwy Cruising Speed may be quite useful. As was pointed out, someone who cruises at 85 mph will get far less MPG than someone cruising at a constant 55 mph. The couple problems with this variable are that for many people (including me), it�s hard to estimate an Avg Hwy Speed. I go anywhere from 55 � 85 depending on traffic, which may yield quite different MPG than someone who just travels at a constant 70 mph. Also, to estimate the average cruising speed would really be a rough ball park number.
I think using Average Speed would probably turn out be the most important variable. It involves NO subjective estimate, and is something which CAN actually be measured. Overall it�s a much better proxy for City/Hwy % driving. One of the biggest problems using % Hwy that I have found while analyzing the data is that it is a subjective estimate, with no hard data behind it. When something is a judgment call, rather than actually measured, it introduces all kinds of problems and judgment error, thus reducing its effectiveness. (That�s also one reason I only included 3 different categories for Driving Style rather than 5 or more).
There are definitely some outliers relative to the estimates, and there is certainly room for improvement. With this idea of improving the analysis, we have to consider a couple things:
1. The ease and feasibility of obtaining the new, reliable information.
2. At this point, people may be sick of this MPG dissection and want to put it to rest.
3. Amount of participation we�ll get.
In conclusion, it looks like significantly improving MPG may be fairly difficult. Based on the data provided, the analysis shows MPG is mostly determined by driving conditions. The roads people drive on (traffic congestion, lights, etc) can�t really be changed, and I would assume people don�t really want to alter their driving style, especially with a car like the RX-8. If anyone has any comments on the analysis or further suggestions regarding understanding the drivers of MPG, I�d really like to hear.
Thread Starter
Registered User
Joined: Aug 2003
Posts: 42
Likes: 0
From: Central Jersey
Interesting Finding:
One BIG outlier in the Actual vs Estimate Graph is the last observation (canzoomer). After doing a bit of forum reading a little while ago, I just discovered he's done some significant work on his engine. Both HP and Torque increased substantially. This is likely one major reason for canzoomer's Actual MPG so much less than the Estimated MPG. I was hoping there was some "external" factor unique to canzoomer's situation that would explain such a large deviation. Perhaps the power increase came at the cost of MPG
One BIG outlier in the Actual vs Estimate Graph is the last observation (canzoomer). After doing a bit of forum reading a little while ago, I just discovered he's done some significant work on his engine. Both HP and Torque increased substantially. This is likely one major reason for canzoomer's Actual MPG so much less than the Estimated MPG. I was hoping there was some "external" factor unique to canzoomer's situation that would explain such a large deviation. Perhaps the power increase came at the cost of MPG


Lubricious
Joined: Oct 2003
Posts: 3,425
Likes: 4
From: SF Bay Area, California
Originally posted by norton
MPG ESTIMATION:
2. For a non-RX8 owner who is contemplating getting the car, this Regression equation can be used to Estimate what their MPG might be, given their % Hwy and Driving Style.
Here is the Equation and an Example of how it works:
Estimated MPG = 18.23 + (5.22 * % Hwy) - (1.19 * Driving Style)
Note: For Driving Style ----- Use 1 instead of A, 2 instead of B, 3 instead of C
For someone Driving 80% Hwy with a Driving Style of B (2), the calculation would be
18.23 + (5.22 * 0.80) - (1.19 * 2) = 20.1 Estimated MPG
Below is a graph of each response Actual vs Estimated MPG. To see your data point, get your observation number from the raw data table below the graph.
Looks like a good correlation. Unfortunately, it does not correlate with the EPA estimates, which suggest a spread of 20-28(!) mpg highway. It seems to me their projections are about 4mpg too high. I wonder if they tested the vehicle before the detuned fuel maps or would be interested in retesting based on this data.

Registered User
Joined: Sep 2003
Posts: 13
Likes: 0
From: delaware
Norton,
This type of analysis is very hard to do with subjective data input such as percent highway driving and driving style. The results are surprisingly good. This looks like it was a "simple" linear correlation of the various factors, one at a time. Do you have any insight as to whether some factors are more important if they are entered as the square of the term, or a combination of factors? For example, the combination of driving style 3 and city driving may be much worse than highway driving and driving style 3. Is the data set good enough to support further analysis?
Ron

uhhhhh....hello?
Joined: Dec 2002
Posts: 1,024
Likes: 0
Last edited by P00Man; Apr 16, 2011 at 08:39 PM.
Thread Starter
Registered User
Joined: Aug 2003
Posts: 42
Likes: 0
From: Central Jersey
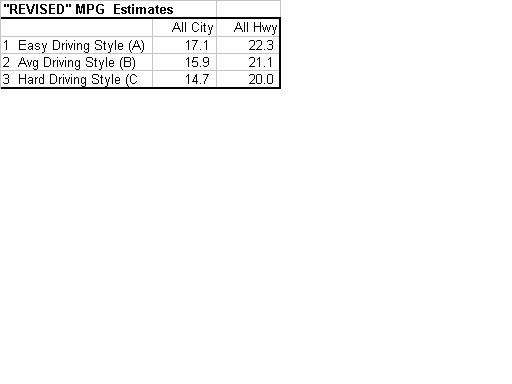
Nubo: You gave me an idea. Based on the regression analysis equation above, I've put together the resultant "REVISED" MPG Estimates. It's actually very simple algebra. Please see the little table below, at the bottom of this post:
**********************************************
Ron: I couldn't agree with you more regarding the subjective data. Per my comment above regarding subjective data, ............
Ron: The correlation, one factor at a time was only a minor aspect of the entire analysis. More enlightening, I believe, was the regression information which followed where multiple variables were assessed.
Ron: The square of the term I did not try.
I did try a combination of variables. In fact, in the Multivariate Regression analysis, I first started with all the various inputs everyone gave me, looking at them simultaneously. Then I weeded out those variables which were not too significant, and was left with % Hwy and Driving Style as important to determining MPG.
Per your question regarding your example, please see the little table below. I believe the regression model addresses exactly the scenario you describe.
Ron: Well, it's pretty good data. I was hoping to have another 10-20 observations. It would have helped reduce the impact of the few outliers. Also, there is the shortcoming of the subjective data. I suppose there's more that could be done with the data, though I'm not sure what people would want to see/try.
**********************************************
This type of analysis is very hard to do with subjective data input such as percent highway driving and driving style.
This looks like it was a "simple" linear correlation of the various factors, one at a time.
Do you have any insight as to whether some factors are more important if they are entered as the square of the term, or a combination of factors? For example, the combination of driving style 3 and city driving may be much worse than highway driving and driving style 3. Is the data set good enough to support further analysis?
I did try a combination of variables. In fact, in the Multivariate Regression analysis, I first started with all the various inputs everyone gave me, looking at them simultaneously. Then I weeded out those variables which were not too significant, and was left with % Hwy and Driving Style as important to determining MPG.
Per your question regarding your example, please see the little table below. I believe the regression model addresses exactly the scenario you describe.
Is the data set good enough to support further analysis?


Pro Audentius
Joined: Jun 2003
Posts: 294
Likes: 1
From: Colorado Springs
Originally posted by norton
Ron: Well, it's pretty good data. I was hoping to have another 10-20 observations. It would have helped reduce the impact of the few outliers. Also, there is the shortcoming of the subjective data. I suppose there's more that could be done with the data, though I'm not sure what people would want to see/try.
Ron: Well, it's pretty good data. I was hoping to have another 10-20 observations. It would have helped reduce the impact of the few outliers. Also, there is the shortcoming of the subjective data. I suppose there's more that could be done with the data, though I'm not sure what people would want to see/try.
Second, it occurs to me you could simply revisit the topic occasionally to collect more inputs as time goes by and accumulated milage increases. When I get an 8 in another few months, and after I've collected some observations, I'll certainly volunteer some data...
Finally, along the lines of using "cruising speed" as a factor, I think you're suspicions are correct. In every car I've owned, I've noted a strong correllation to MPG and speed... on a tank of gas, I've noted probably on the order of 2-3 MPG, depending on my adherence to the speed limits :D
Thread Starter
Registered User
Joined: Aug 2003
Posts: 42
Likes: 0
From: Central Jersey
SpacerX:
Sure, I would be very happy to occasionally rerun the model based on new data. If anyone wants to update their response after more mileage has accumulated on their car, please do so. Or, if anyone wants to provide data for the first time, that's fine too. Rerunning and updating everything is a relatively easy job now that the analytical infrastructure is in place........ basically two glasses of vodka, one joint, and a few computer keys to press.
All in all, at this point I feel comfortable that we have determined a couple things, though not too surprising:
1. GrandMa driving improves mileage.
2. Boring highway driving yields the best mileage.
This is true among any car, though perhaps more so with the RX-8. I think the interesting thing is that no other factors were determined to be significant thus far.

Registered User
Joined: Oct 2003
Posts: 102
Likes: 0
From: North of Spokane WA
Great analysis.
The sticker on my AT reads 18 to 25.
Here's an excerpt from the government's web site regarding the window sticker figures.
"Manufacturers test pre-production prototypes of the new vehicle models and submit the test results to EPA. EPA re-tests about 10% of vehicle models to confirm manufacturer's results. The vehicles are driven by a professional driver under controlled laboratory conditions, on an instrument similar to a treadmill. These procedures ensure that each vehicle is tested under identical conditions; therefore, the results can be compared with confidence."
The window stickers also say
"Results reported to EPA indicate that the majority of vehicles with these estimates [18 - 25] will achieve between
15 and 21 mpg in the city, and between 21 and 29 on the highway."
Fortunately, I've been getting good gas mileage and seem to fit right in with the analysis' conclusions. Because of a speeding ticket I received (that will be dismissed if I don't get any more this year), I have kept the speed within the posted limits via the cruise control.
The slower speed has taught me a lesson about speed vs gas mileage and now that premium gas is quite high, I'll probably continue "taking it easy". One good thing about driving slower than usual -- I see a lot more people oogling my Winning Blue.
Originally posted by Nubo
Looks like a good correlation. Unfortunately, it does not correlate with the EPA estimates, which suggest a spread of 20-28(!) mpg highway. It seems to me their projections are about 4mpg too high. I wonder if they tested the vehicle before the detuned fuel maps or would be interested in retesting based on this data.
Looks like a good correlation. Unfortunately, it does not correlate with the EPA estimates, which suggest a spread of 20-28(!) mpg highway. It seems to me their projections are about 4mpg too high. I wonder if they tested the vehicle before the detuned fuel maps or would be interested in retesting based on this data.
Here's an excerpt from the government's web site regarding the window sticker figures.
"Manufacturers test pre-production prototypes of the new vehicle models and submit the test results to EPA. EPA re-tests about 10% of vehicle models to confirm manufacturer's results. The vehicles are driven by a professional driver under controlled laboratory conditions, on an instrument similar to a treadmill. These procedures ensure that each vehicle is tested under identical conditions; therefore, the results can be compared with confidence."
The window stickers also say
"Results reported to EPA indicate that the majority of vehicles with these estimates [18 - 25] will achieve between
15 and 21 mpg in the city, and between 21 and 29 on the highway."
Fortunately, I've been getting good gas mileage and seem to fit right in with the analysis' conclusions. Because of a speeding ticket I received (that will be dismissed if I don't get any more this year), I have kept the speed within the posted limits via the cruise control.
The slower speed has taught me a lesson about speed vs gas mileage and now that premium gas is quite high, I'll probably continue "taking it easy". One good thing about driving slower than usual -- I see a lot more people oogling my Winning Blue.

Bottom feeder
Joined: Aug 2003
Posts: 540
Likes: 2
From: Bikini Bottom
Norton deserves an A for effort, but In the end, his lengthy analysis only confirms the obvious. I think most people would have come to that conclusion without much effort.
Hard driving spends more fuel.
Highway driving gives better mileage than city driving (as indicated by all MPG reports).
Tell me I'm wrong, but that's pretty damn obvious.
Hard driving spends more fuel.
Highway driving gives better mileage than city driving (as indicated by all MPG reports).
Tell me I'm wrong, but that's pretty damn obvious.
Registered User
Joined: Sep 2003
Posts: 13
Likes: 0
From: delaware
Norton,
Thanks for your comments. Another potential "independent" variable is the number of cold starts. I did this type of analysis for another car many years ago and a cold start is devastating to the gas mileage. I think that this would be especially bad for the RX-8 since it apparently runs rich at low rpm and apparently even more so at start-up based on all of the flooding comments. Hope that this helps.
Ron
PS
Do you have an estimate of the error band? This is something that is not eassily obtainable from seat of the pants analysis.
PPS
What happens if you exclude data from the analysis that is "bad" for cause?
Registered
Joined: Aug 2003
Posts: 196
Likes: 0
From: Alto, Michigan
I have most of my gas slips with calculated mpg @ odo reading with 4600 miles on my car. Another variable is the VIN. Mine is 00502, significantly earlier than those in your study. Would you like to be flooded with more data? cc
Thread Starter
Registered User
Joined: Aug 2003
Posts: 42
Likes: 0
From: Central Jersey
Norton deserves an A for effort, but In the end, his lengthy analysis only confirms the obvious. I think most people would have come to that conclusion without much effort.
All in all, at this point I feel comfortable that we have determined a couple things, though not too surprising:
o We now have an idea of How Much Hard Driving reduces MPG and How Much Hwy Driving improves MPG.
o Given an individual's % Hwy and Driving Style, they can see how they "fit" with the rest of the pack.
o I think it's probably safe to assume the EPA estimates are exaggerated by a couple MPG.
o Importantly, we can safely omit other variables we were wondering about signficantly impacting MPG (eg. VIN).
Thread Starter
Registered User
Joined: Aug 2003
Posts: 42
Likes: 0
From: Central Jersey
"Manufacturers test pre-production prototypes of the new vehicle models and submit the test results to EPA. EPA re-tests about 10% of vehicle models to confirm manufacturer's results.
******************************************
Do you have an estimate of the error band? This is something that is not eassily obtainable from seat of the pants analysis.
I did try dropping two outliers. The resultant estimates increased about 0.2 MPG. Actually, this is an important point because it illustrates that the Estimate Equation is very stable. By the way, I also added 2 new observations.... No change to the results though, other than decreasing the Standard Error.


Registered User
Joined: Sep 2003
Posts: 18
Likes: 0
From: Aloha, Oregon
Well, I don't know what you can do with my info, but my RX-8 is for weekend fun (I have other cars and trucks for day-to-day). I go to redline most times off the line in town(1st only), use 97 octance, and hit over 100mph at least once every time I hit the freeway (but not for long), and I get about 15 mpg. I hate the gas mileage, but if I could ever stop hitting the gas pedal, I could probably approximate the EPA, or get close.
But you know what ? I really don't care, because those few minutes over legal are so fun !!!!
AND last week, I was actually driving sane, doing 40 in a 35, coming up to a light that was green, a minivan in the RED lighted left turn lane that was STOPPED decided to get in my lane about 30 feet in front of me, and I swerved to avoid her ! Any other car I have driven, including my Corvette (maybe...)would have rolled. I got sideways rubber on all 4, but other than 10 years off my life based on my heart-rate, no damage.
Thanks Madza !